
I built an interactive globe without WebGL or map tiles
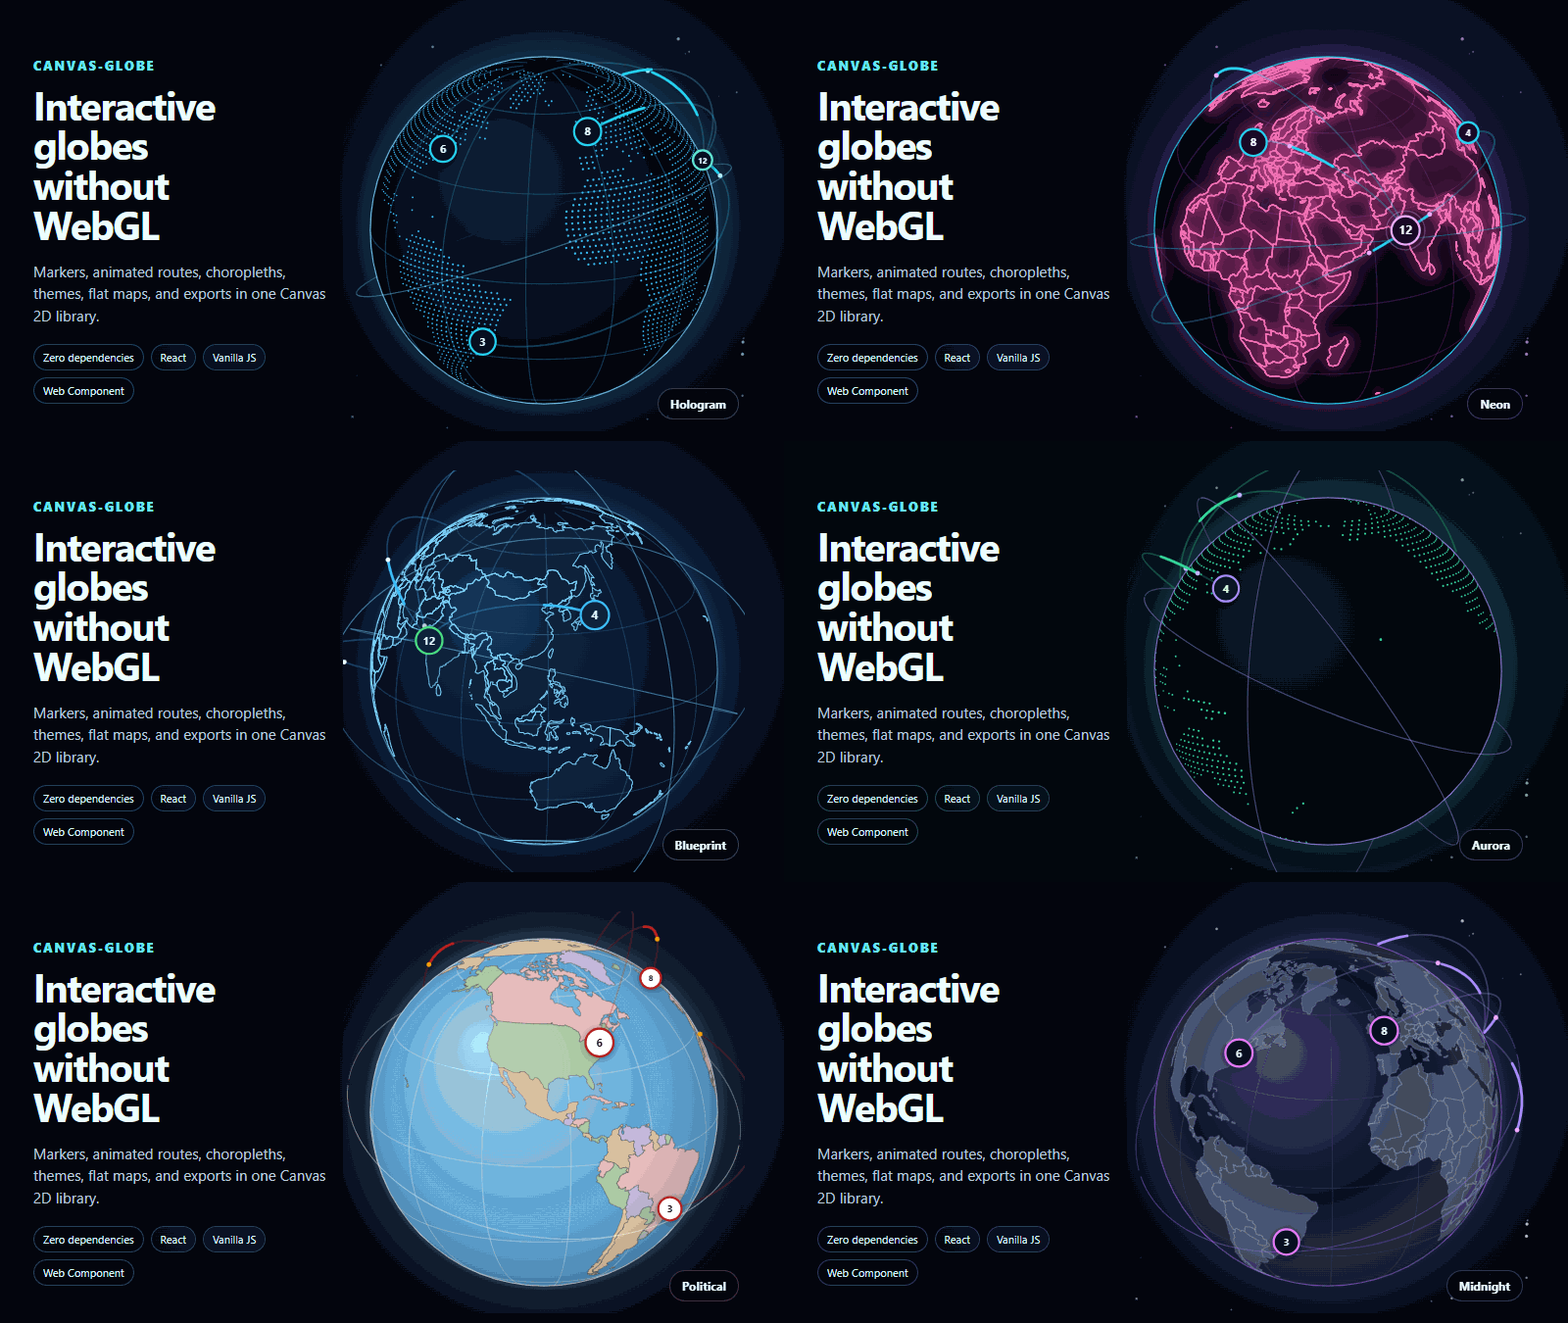
The requirement sounded small: put an interactive globe on a web page.
I wanted people to drag it, zoom it, hover over countries, place markers, and draw routes between cities. I also wanted the result to feel at home inside dashboards, launch pages, status boards, and reports.
The tools I tried were built for bigger jobs. Some were full 3D engines. Others were complete mapping platforms. Both are useful, but I did not want every project to configure a map provider, load map tiles, or build a 3D scene just to show a focused globe visual.
So I wrote down a few rules:
- use the browser's regular 2D canvas
- require no map API key
- make no required network calls while running
- keep runtime dependencies at zero
- let the same data work on a globe and a flat world map
That project became CanvasGlobe.
Drawing a circle was the easy part
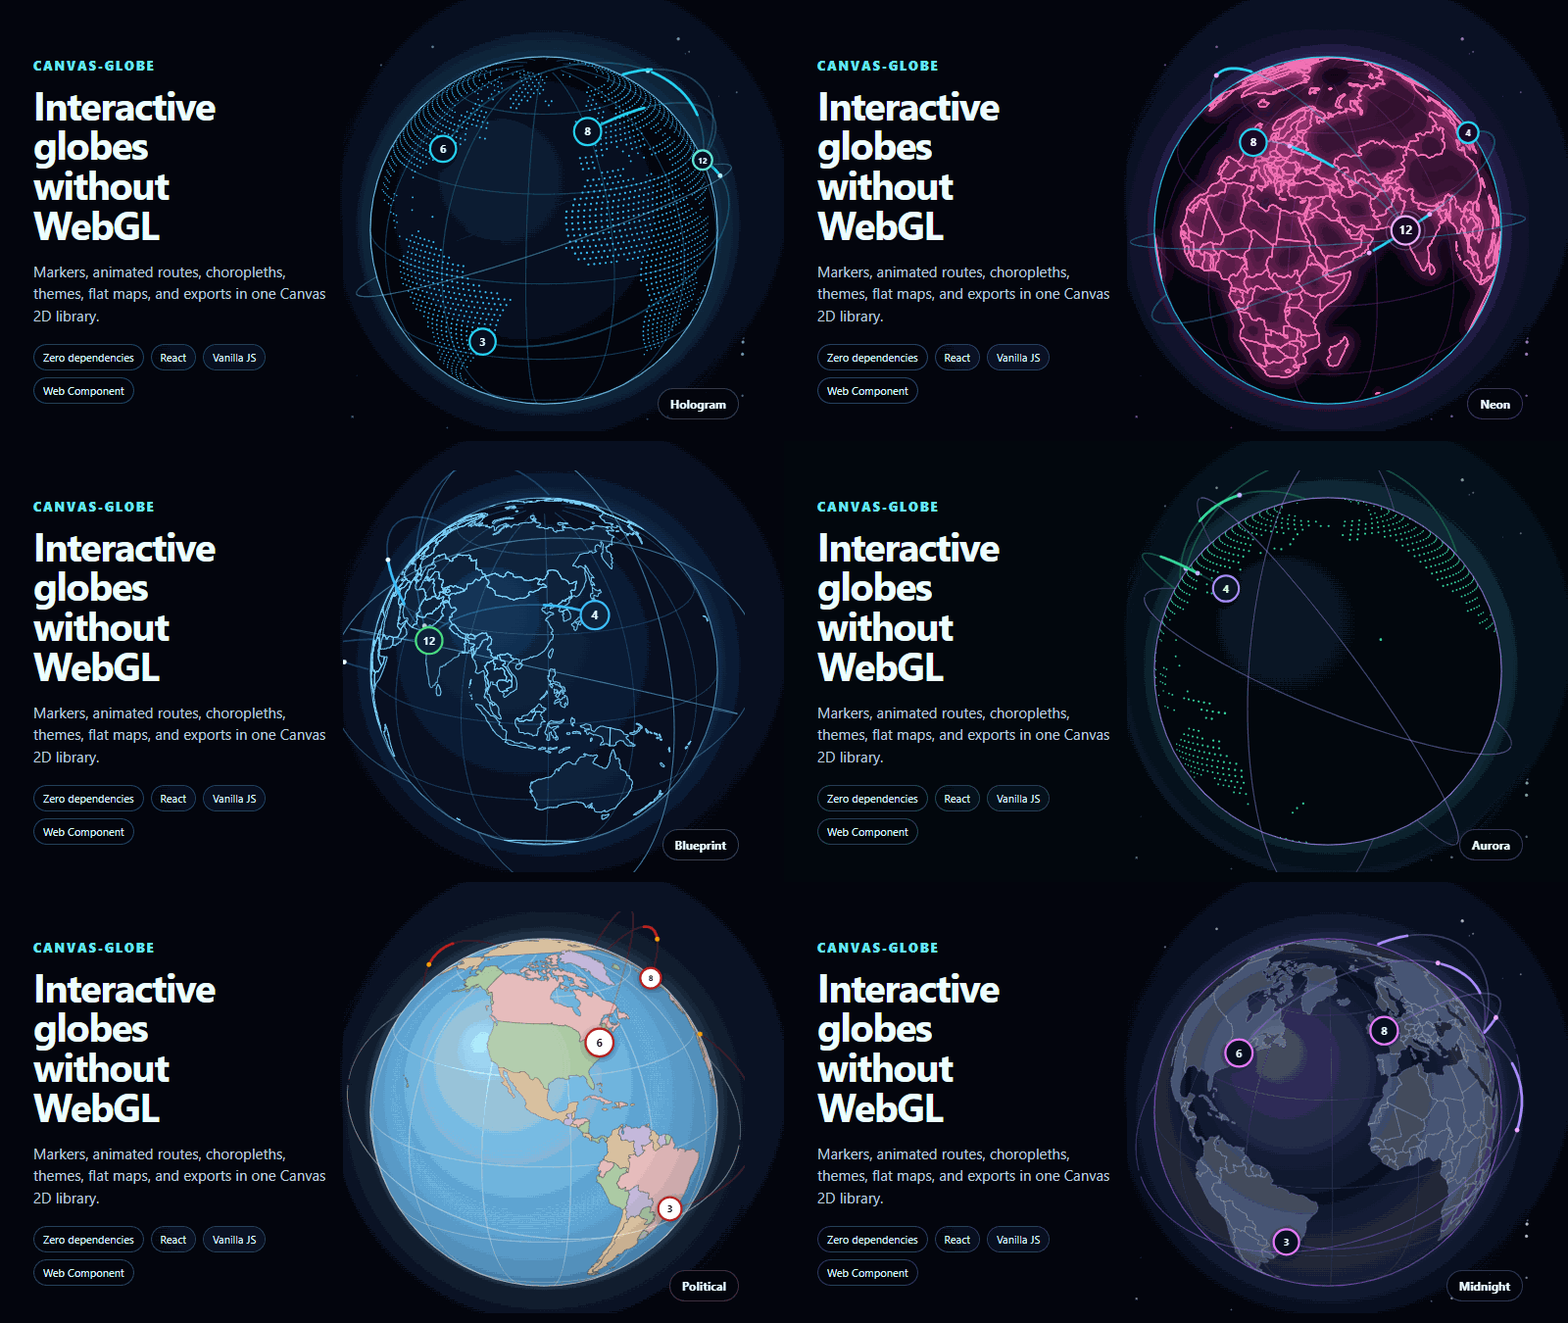
CanvasGlobe uses an orthographic projection. In ordinary language, it shows one half of Earth as if you were looking at it from far away. That creates the familiar round globe without a 3D engine.
For every geographic point, the library works out its horizontal position, vertical position, and whether it belongs on the front or back of the globe.
That last answer creates most of the depth. A marker on the far side should disappear. A route should pass behind the Earth instead of showing through it. Countries near the edge should gradually leave the visible side.
The browser is still drawing pixels on a flat canvas. The three-dimensional feeling comes from hiding the right pieces, changing size and shading, and keeping everything aligned while the globe rotates.
The first version broke near the edge
Hiding points on the back worked for markers, but countries are not single points. A country near the edge can be partly visible and partly hidden.
My first attempt simply removed the hidden part. That left shapes open, so filled countries sometimes flickered or drew strange lines across the globe.
The fix was to find the exact places where an outline crosses the visible edge. CanvasGlobe draws the visible section, follows the circular edge across the hidden gap, then continues when the country comes back into view.
It sounds like a small detail, but it changed the whole result. Before the fix, the globe looked like a flat map placed inside a round mask. After it, countries appeared to move around a sphere.
Routes needed their own logic
A straight line between two longitude and latitude values is not usually the shortest path across a globe. It also behaves badly when a route crosses from one side of a flat world map to the other.
CanvasGlobe calculates points along the surface of a sphere instead. This is the same reason long-distance flight paths often look curved on a flat map.
The useful part is that the route data is not tied to one view. On the globe, its hidden section travels behind the Earth. On a flat map, it follows the selected projection. A user can switch views without rebuilding the data.
Interaction had to work beyond a mouse
It was easy to make dragging feel good and still overlook keyboard users or people who prefer reduced motion.
When interaction is enabled, the canvas can receive keyboard focus. Arrow keys rotate the view, plus and minus control zoom, and 0 resets it. Page Up and Page Down move between markers. Enter or Space activates the selected marker.
The library also respects the browser's reduced-motion preference. Automatic rotation and decorative animation stop when someone has requested less movement, while direct controls keep working.
There is still an important limit: useful information should not exist only as pixels. If a globe communicates actual data, the surrounding page should also provide a table, summary, or another readable HTML view.
An idle globe should be quiet
Canvas does not remember objects in the way normal HTML does. When something changes, the scene must be drawn again.
The simplest approach is to repaint on every screen refresh, even when nothing is moving. CanvasGlobe instead tracks whether the scene is dirty and whether an animation is active. It draws during a drag, a smooth move, rotation, or an animated route. When the scene is idle, it stops doing the same work again.
That matters on pages where the globe is only one component among many.
What I deliberately left out
Canvas 2D gave the project a useful boundary. CanvasGlobe is not intended for terrain, buildings, custom 3D models, street-level maps, advanced lighting, or thousands of objects in 3D space.
For those jobs, I would use a tool such as globe.gl, MapLibre GL JS, or CesiumJS.
I was not trying to replace a complete mapping platform. I wanted to cover the space between a static globe illustration and a full 3D engine.
Try it
Install the package:
npm install canvas-globe
Then add a canvas and create the globe:
import { createGlobe } from "canvas-globe";

const globe = createGlobe(document.querySelector("#globe"), {
  theme: "atlas",
  markers: [
    { lat: 23.03, lon: 72.58, city: "Ahmedabad" },
    { lat: 51.50, lon: -0.12, city: "London" },
  ],
  arcs: [
    { from: [72.58, 23.03], to: [-0.12, 51.50] },
  ],
  tooltip: marker => marker.city,
});
You can explore it through the live playground, browse the examples, read the GitHub repository, or install it from npm.
CanvasGlobe is available under GPLv3 for compatible open-source projects. If you are distributing it in a proprietary product, you need a commercial license. See the plans and pricing.
The library is still early. If you try it, I would genuinely like to hear where the API feels awkward, how it behaves on lower-end phones, and which real-world globe use cases are still missing.